Slimming World Homepage
Focus and speed gives 50% drop in bounce rate
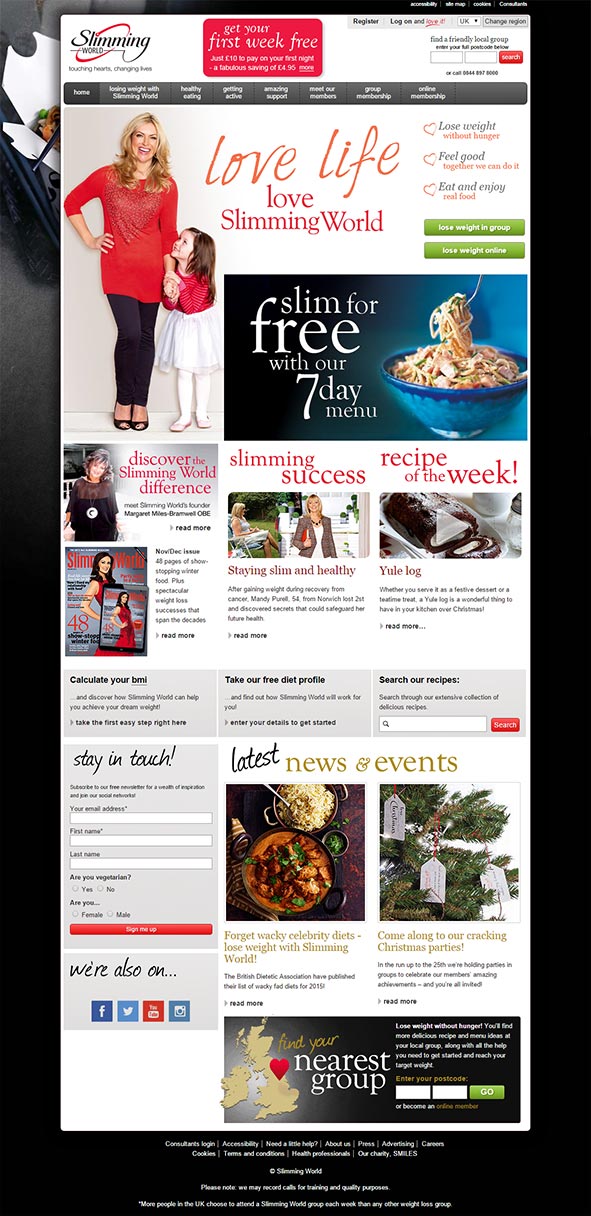
This was a short project to refresh the design of the company public homepage. The previous iteration, shown in fig. 1, suffered from ‘content creep’ — new features added over time with little regard for the content hierarchy meant the page was trying to priortise everything, and ultimately priortised nothing.
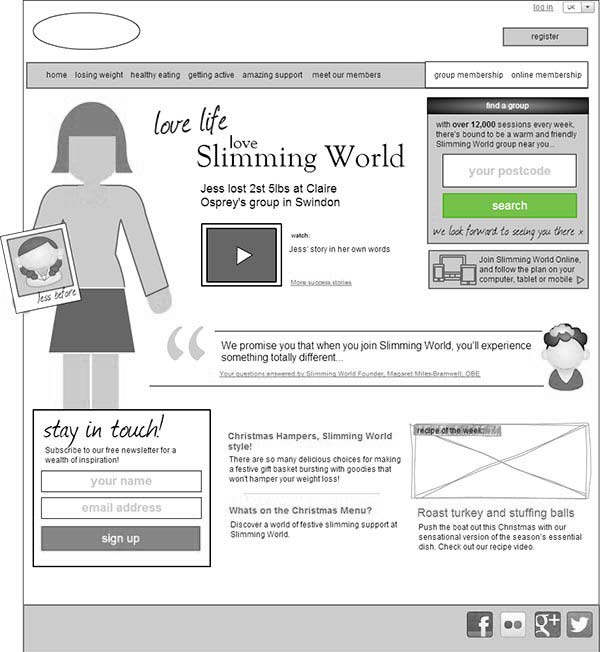
Initial designs
Liasing closely with the content and online support teams and studying analytics data allowed me to wireframe layouts that focused on the user and business needs.
Code & the critical rendering path
When the final design was refined and signed–off, I hand coded the page with download speed and performance as a primary requirement. To this end, I created a bespoke template and separated the CSS in to two parts:
- The content that is most likely to be in the viewport on initial page load has its CSS minified and inlined in to the HTML
<head>, allowing that part of the page to render as quickly as possible. - If Javascript is available, the CSS for the rest of the content is loaded after the HTML has finished downloading. Additionally, the main CSS for other content pages is loaded to take advantage of browser caching and improve performance on subsequent pages.
Results
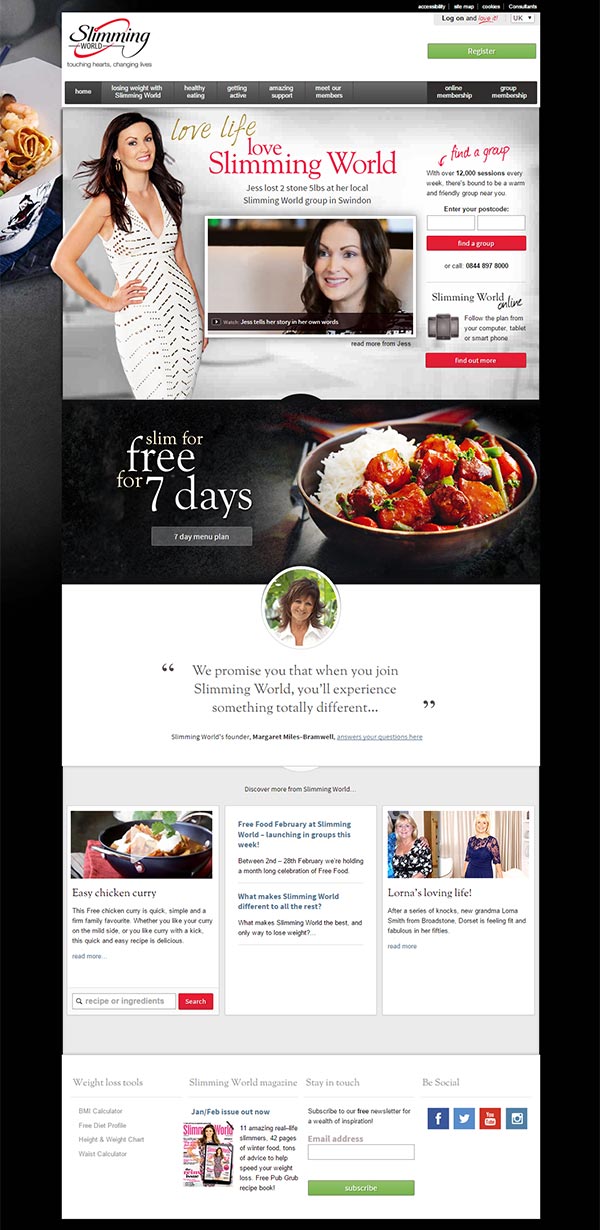
Optimising the critical path as described above results in essential content being available and interactive in an average of under 1 second, and the page fully rendered in under 2 seconds.
Overall page engagement improved dramatically, with the bounce rate dropping by over 50%; from around 23% of visits only viewing this single page, to (at the time of writing) averaging around 11%.
Additionally, a primary business goal, the number of users searching for their local group, increased by over 20% when comparing February 2014 to February 2015.